
via Money Maker Edge Live Trading Room https://www.moneymakeredge.com/market-recap-august-23/
SPY Daily Chart
The chart is showing a repetitive pattern, noted in the boxes, for the top and a pullback on the daily chart for $SPY. Price has broken the bullish trendline and is showing the sellers in control here. In June we had a golden cross where the 50MA crosses the 200MA. Looks like price wants to challenge the 200MA again and maybe a move to previous swing lows.

We see a lower high with a potential for forming a head and shoulders. We are in an uptrend but we are testing the bullish trend line. If we break the trend line, watch for it to go to support and if this doesn’t hold, we could get a move to the previous swing lows.

We see a lower high and it looks like it may challenge the support. And if it is broken, look for it to close the gap on the lower support. Take note of the volume of sellers entering the marketplace.
Market recap August 23, not a trade suggestion. Manage your own risk. Never listen to others and if you don’t know what you are doing, consult your investment adviser.
The post Hourly Charts SPY and QQQ appeared first on Money Maker Edge Live Trading Room.

This is August trading with lower volume and sometimes extended range days. Could take a few more days for trades to hold their support. Take your time here as tweets have been moving this market. The pull back and forth between Trump and the FED are moving the markets almost daily. It doesn’t look like the FED is going to acquiesce to Trumps pressure to drop rates to keep in line with other central banks. We shall see. Always trade with a stop and a target.
Watch list August 22 CYBR day trading set up.
CYBR has bounced off of support, has a higher low and volume is consistent at this point. Watch for a red to green move on the open.

After a big run up today and about a $10 range, watching for a slight pull back and keep this direction. Higher low on this with a target around the 50MA. Watch for a volume increase into the weekend.
Watch list August 22,Reste ZM set up for day trading
ZM is bouncing off of support watching for this to gain support at the closing levels, wait for this to reverse for a clear entry.
Trade at your own risk, remember only you can be responsible for your trades. Refer to the Money Makers Edge™ traders code if in doubt.
The post Live Trade Room Watch List August 22, 2019 appeared first on Money Maker Edge Live Trading Room.

The post Gold trading and Dollar index who will lead? appeared first on Money Maker Edge Live Trading Room.
The post Stock market at highs showing weakness, day trading tops. appeared first on Money Maker Edge Live Trading Room.

AMRN live day trading chart Watch as the daily chart has posted an bull flag on the run up from $17.00 if we can keep the consolidated pattern, then we could have a break over $21 to challenge the swing highs.

IWM weekly chart Watch as this Inverted Head and shoulders plays out. We could get the next leg up after some consolidation.
The post Live trading April 2, 2019 live trade room appeared first on Money Maker Edge.
These are the small cap stocks and large cap stocks I will be watching at the open on Friday: $NFLX $ROKU $CLRO $APDN $BIOC $CLO $XLF $FAS $CGC
These are the small cap stocks and large cap stocks. Mostly swing trades.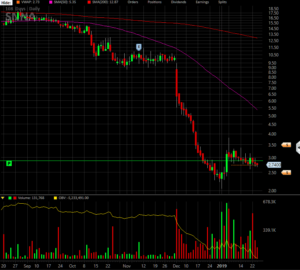 $SNNA
$SNNA
This stock is consolidating,
Small stop 1×4 risk to reward
 $OMED
$OMED
Trend line is supporting the buying
50MA is a good target
volume is about to come back in
Price is coiling for a break out

$RGSE
Consolidation
bouncing on support
Under the 50MA and 200MA

$OGEN
Consolidation
volume is low
Swinging for previous highs
1×6 risk to reward
 $AMD
$AMD
large cap stock
broke above trend line
bumping up against resistance
volume is consistent
Flat top break out
 $OBLN
$OBLN
on support
buyers have come in
watching for a reversal to the 50MA
next target could be the 200MA
 $TOPS
$TOPS
Broken out from the bottom
forming a right side shoulder
shows history of big moves
1×4 risk to reward
 $XLI large cap stock
bullish flag
V Bounce with consistent volume on the move up
Left side support in
Above the 50MA and the 200MA
Could have a powerful breakout
 $EKSO
$EKSO
Bullish flag
broke above the 50MA
headed to the 200MA
Volume is slightly increasing
 $GEVO
$GEVO
bull flag
volume relatively high compared volume before spike
Above 50MA acting as support
looking for a continuation move like the price spike.
 $INPX
$INPX
bottoming pattern
could bounce
50 Moving average target
Volume is decreasing
Looks like could retrace part of the move down
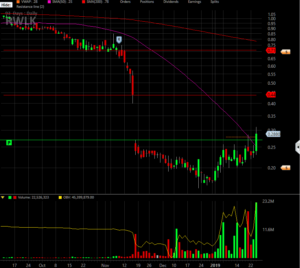 $RWLK
$RWLK
broke over resistance
Good volume
Watch for carry through tomorrow
Might swing into next week
Day trading is high risk. These are not trade suggestions, never follow anyone’s trades. Do your own work and learn how to trade slowly. You can loose all your money and more. We offer courses and a live trading room.
Calgary Day Trading Course Edmonton Day Trading Course Montreal Day Trading CourseThe post Small Cap stocks and open position – Friday stocks appeared first on Money Maker Edge.
 AMD Watching a slight retrace tomorrow for an entry.
We are above the 50 MA and if that support holds we can revisit where the Swing high a few weeks ago closed the gap.
This is the first area of resistance short term is $21 then 23.50 and then to $25.
If we open below 19.85 adn the overall futures market is week, AMD could pull back to support at $19 then bounce or break support for a move t new lows.
The devils advocate on this trade would be for this to be a Head and shoulders continuation and this consolidated zone is setting up the next move down.
Facebook trade set up live trade room
 If Facebook pulls back to Fridays high we are going to watch for the red to green reversal for a break of today’s high.
We have a few conflicting patterns. If this consolidated zone with a Head and Shoulders is a continuation pattern this might break under the 200MA and then head for more lows.
The bullish side of this trade is looking for a red to green move off the open with an open above 19.77. This is the 50MA support, if it holds, then we could see a push into the right side consolidation zone. Is this double bottom and the closing of the July gap enough to break the bearish trend line? We shall see.
The Pennant is almost directly in the middle and might hold depending on the open tomorrow.
What is interesting here is that the death cross did not occur with this move down.
The post 2019 January 14 live trades Stocks appeared first on Money Maker Edge.
S&P500 ETF $SPY trading chart. We are going to look at the S&P500 areas of support and resistance.

S&P500 support and resistance
Watch price action on $SPY we put in a high volume low with sellers capitulating in the Bear Market Price Zone. We called this level in our Live trading room to watch for a bounce.
S&P500 support becomes ResistancePrice broke under the correction level (Red Zone) of 10% from the top and proceeded to Bear Market Price zone in green which acted as support.
In price action trading prior support in a down trend becomes Resistance when price reverses.
The 10% price correction off the top is a consolidated zone that finally broke Mid-December with a volume push and sellers took control of direction. This is where the support level at 2600 will now become resistance.
S&P500 50MA acts as resistanceThe 50MA also will act as Resistance (like a ceiling) for the $SPY. Keep this in mind for your strategy and manage your risk first.
This will be a key area as Algos could roll from a net short to an active buy zone.
The post S&P500 support and resistance – old support Essential Chart appeared first on .